Rust step by step debugging with Visual Studio Code
At the very beginning, I want to share my development environment for Rust. While I’m writing, I changed my mind in the middle of writing adding debugger’s too. It seems more valuable to help others.
Visual Studio Code

I use the Visual Studio Code for creating Rust applications. My environment is not the best. To hear about your development environment, I want to share mine first. Please share your environments in replies. I’m open to the new one. For simplicity and lightweight, I select the Visual Studio Code. It’s powerful too. Then, the most important things are the extensions.
Extensions
crates
The crates extension helps me managing packages in the project. [1]
rust-analyzer
While programming in Rust, it gives me warnings, errors, and hints when calling functions. It boosts productivity a lot. [2]
I try to find about debugging in Rust. How we can use debugger with the Visual Studio Code.
Debugging with Visual Studio Code
dbg! macro - the Basic
First, the most basic one prints the variable, or we can use println! macro.
fn main() {
  let a = 6;
  dbg!(a);
  println!("{}", a);
The dbg macro[3] gives more information than the println macro. It shows a line number and a file name too.

gdb(pwndbg)
I think the pwndbg [4] makes the GDB [5] more visually friendly. Unfortunately, I have been failed to use the pwndbg since this issue arises [6]. I saw how does it look like while debugging. The package brings the debugged source code to the top part of a screen. Instead of pure GDB, I can debug by watching the source.
Here are postings about how to use pwndbg. https://blog.xpnsec.com/pwndbg/ https://www.ins1gn1a.com/basics-of-gdb-and-pwndbg/
CodeLLDB - Step by Step Debugger
I followed these steps [7] to install the CodeLLDB [8]. It’s an extension in the Visual Studio Code. All the steps are working. My versions are followings.
$ rustc --version
rustc 1.48.0 (7eac88abb 2020-11-16)

visual studio code
1.52.1

CodeLLDB (Visual Studio Code Extension)
v1.6.0
In step 7, I need to set “launch.json” and I used this.
//launch.json
  "version": "0.2.0",
  "configurations": [
    {
      "type": "lldb",
      "request": "launch",
      "name": "Debug executable 'example'",
      "cargo": {
        "args": [
          "build",
          "--bin=example",
          "--package=example"
        ],
        "filter": {
          "name": "example",
          "kind": "bin"
        }
      },
      "args": [],
      "program": "${workspaceFolder}/target/debug/example",
      "cwd": "${workspaceFolder}/target/debug/",
      "sourceLanguages": ["rust"]
    },
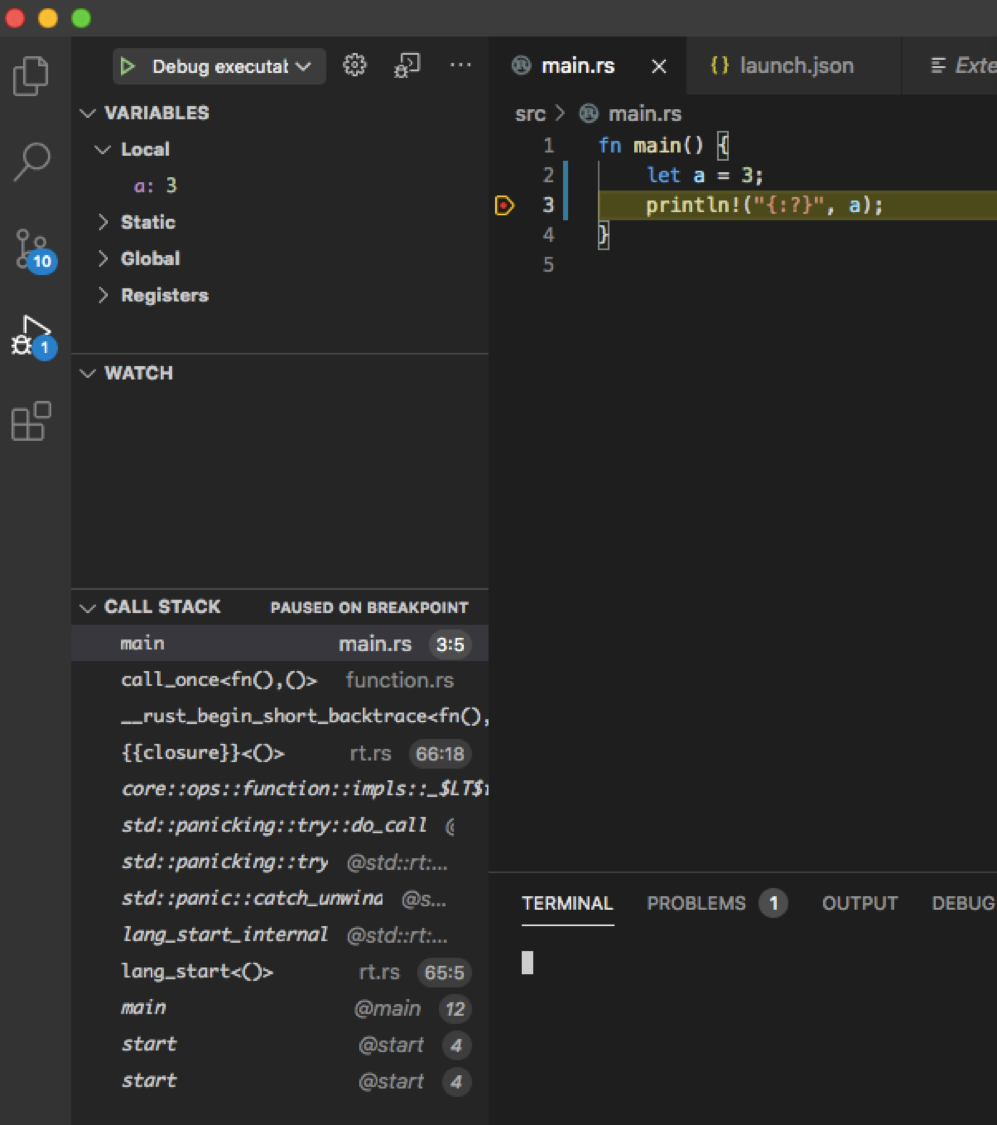
I can use a step-by-step debugger as the following image. On the left sidebar, we can see the variable ‘a’ is 3.

References
[1] https://marketplace.visualstudio.com/items?itemName=serayuzgur.crates
[2] https://marketplace.visualstudio.com/items?itemName=matklad.rust-analyzer
[3] https://doc.rust-lang.org/std/macro.dbg.html
[4] https://github.com/pwndbg/pwndbg
[5] https://en.wikipedia.org/wiki/GNU_Debugger
[6] https://github.com/pwndbg/pwndbg/issues/855
[7] https://stackoverflow.com/a/52273254/5742992
[8] https://marketplace.visualstudio.com/items?itemName=vadimcn.vscode-lldb


Leave a comment